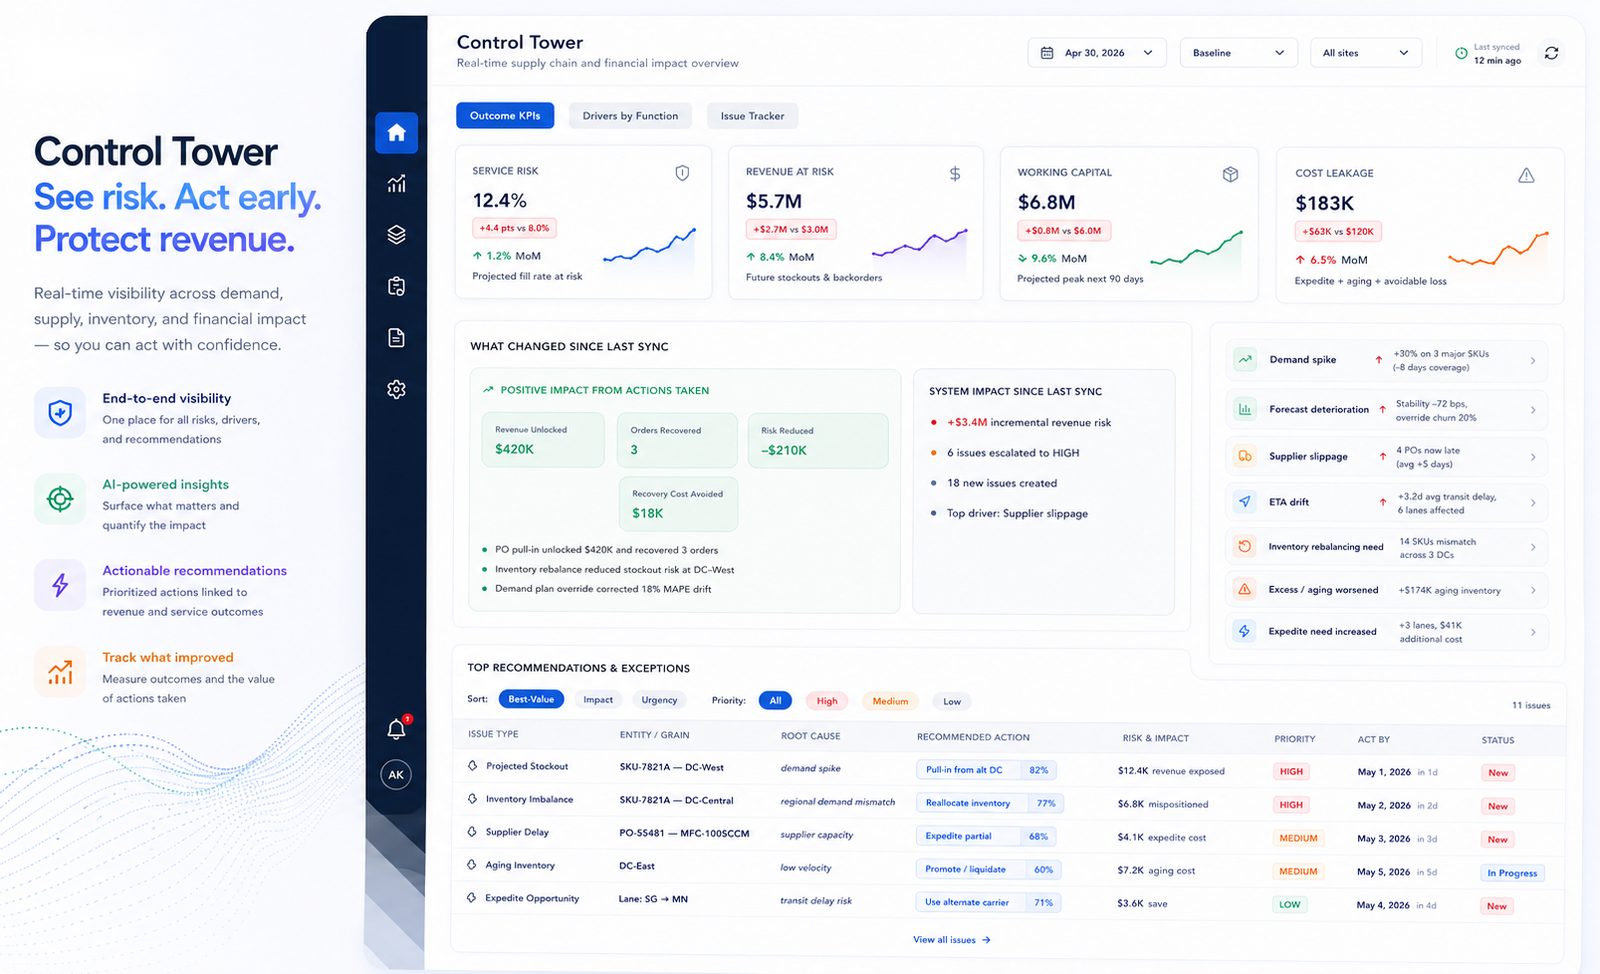
Your ERP, MRP, APS, and spreadsheets each hold a piece of the plan. The Plantryx Control Tower sits above all of them — whatever planning you run today — watching continuously, and turning changes into prioritized, sized, recommended decisions.
Outcome KPIs are configurable to your business, refreshed continuously, with every move linked to the specific issues driving it — so you drill from the number to the order. A typical set:
Projected fill and OTIF risk over the forward horizon — before commitments are missed.
Future stockouts and at-risk orders, valued — ranked by which customers and orders they hit.
Projected inventory position at cost — where cash is trapped and where it's about to be.
Expedites, aging inventory, and avoidable spend — the margin quietly leaking out of the plan.
Executives steer by outcomes; functional leaders live in the drivers. Each function gets its own diagnostic KPI set that explains what's moving the outcomes — configurable like everything else, and every card clicks through to the issues behind it. For example:
Projected stockouts, backorder gap, demand volatility, forecast stability.
Inbound PO risk, supplier reliability, lead-time drift, confirmation gaps.
Excess & aging, stock imbalance, days-of-coverage risk.
Shipment ETA risk, expedite exposure, mode-mix drift.
Swap in the measures your teams already run on — the drill-down from KPI to driving issue works the same at both levels.
Decision lag is the gap between when something changes and when your team acts on it. The control tower closes that gap — and shrinks the planning cycle from days of spreadsheet triage to a ranked queue.
Every refresh surfaces what changed since the last run: demand shifts, supplier slippage, shortages, promise-date risk, excess building.
Issues are ranked by business consequence — expected value, urgency, and days to impact — not by who shouts loudest.
Every issue is quantified before anyone opens a spreadsheet: revenue at risk, cost to recover, time to failure.
Each issue carries a recommended action with a confidence score, plus alternatives to compare — owned and worked in one shared workspace.
Approved actions flow back into your workflow. Routine moves can auto-execute within policy thresholds your team sets; everything else waits for a planner.
Every run opens with what moved since the last one — which risks grew, which resolved on their own, which forecasts shifted and why. Your Monday meeting starts with the answer, not the investigation.
When AI diagnoses an issue or writes a narrative, every number in it is traceable to a published fact from your systems — the order, the PO, the inventory position. No black-box scores, no hallucinated impacts. If the data can't support a claim, the platform says so instead of making one up.
The control tower stands alone — start here even if planning stays where it is today, and add Plantryx planning modules when you're ready.
A decision layer that sits above your ERP, MRP, APS, and spreadsheets, watching the plan continuously and turning changes into decisions. It exists to close decision lag — the gap between when something changes and when your team acts on it.
No. The control tower works with whatever planning you run today — ERP modules, point tools, or Excel — and stands alone. Many teams start here and add Plantryx planning modules later.
Whatever your business steers by — KPIs are configurable. A typical outcome set is service risk, revenue at risk, working capital, and cost leakage, with driver KPIs by function (demand, supply, inventory, logistics) beneath them for functional leaders.
It recommends by default and executes with planner approval — or automatically, within policy thresholds your team has pre-approved. Routine moves can run on their own; everything else waits for a person.
A dashboard shows you numbers and leaves the investigation to you. The control tower flags what changed, ranks it by business consequence, sizes it in dollars and days, and attaches a recommended action — with every AI claim traceable to a fact in your data.
Most planning teams can't put a number on what their planning gaps cost. That number is exactly what the diagnostic delivers — from a focused data extract, no integration required.